In the vast realm of the internet, understanding the behavior of your website visitors is crucial for success. Optimising Website Traffic Insights, a powerful tool that empowers website owners with valuable insights into user interactions. In this article, we’ll unravel the mysteries of Google Analytics, providing a beginner-friendly guide to help you navigate and leverage this indispensable tool.
What is Google Analytics?
Optimising Website Traffic Insights is a free web analytics service offered by Google that allows website owners to track and analyze various aspects of their site’s performance. From visitor demographics to page views and conversion rates, Google Analytics provides a comprehensive overview of how users interact with your website.
Let’s Start with Google Analytics
Step 1: Create a Google Analytics Account
To get started with Google Analytics, you need a Google account. Once you have one, visit the Google Analytics website and sign in. Follow the prompts to create an account for your website, providing essential details such as your website name and URL.

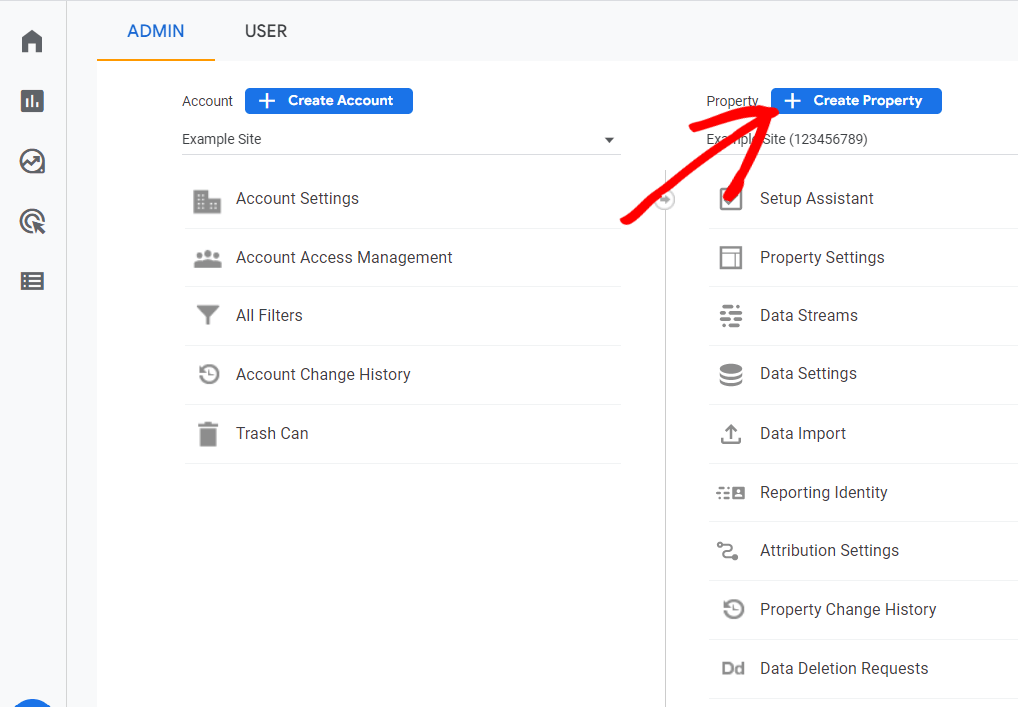
Step 2: Set Up a Property
After creating an account, you’ll need to set up a property for your website. A property represents the individual website or app you want to track. Follow the on-screen instructions to complete this setup, including specifying your industry category and reporting time zone.
Step 3: Get Your Tracking Code
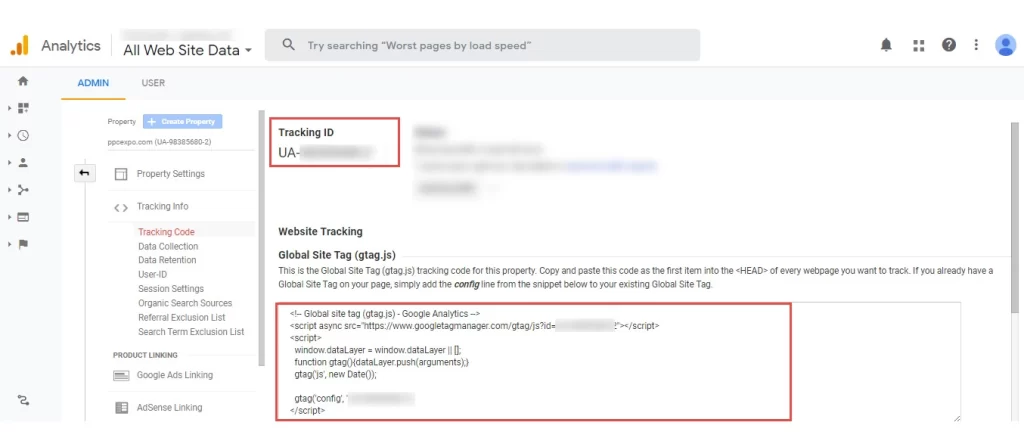
Once your property is set up, Google Analytics will provide you with a unique tracking code. This code is a snippet of JavaScript that you need to add to every page of your website. This code is what enables Google Analytics to collect data about your visitors.
If you’re using a website builder or content management system (CMS) like WordPress, you can often add the tracking code in the settings. If you’re not sure how to do this, a quick online search or a support query with your platform of choice should guide you through the process.
Understanding Key Google Analytics Metrics
1. Sessions
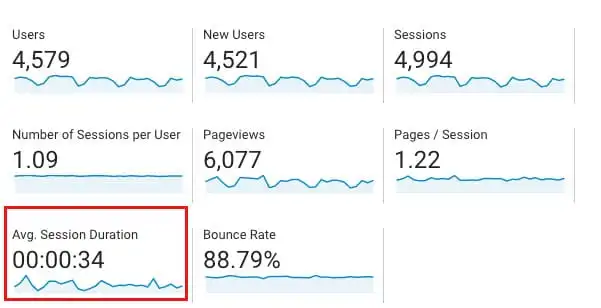
A session is a period of time during which a user interacts with your website. It starts when a user arrives at your site and ends after a specified period of inactivity, usually 30 minutes. Sessions help you understand how often people engage with your site.
2. Users
The users metric tells you the total number of unique visitors to your site. It provides a fundamental insight into your website’s reach.
3. Pageviews
A pageview is recorded each time a user views a page on your website. It helps you understand which pages are the most popular and engaging for your audience.
4. Bounce Rate
The bounce rate is the percentage of single-page sessions, indicating users who left your site without interacting further. A high bounce rate may suggest that your content or user experience needs improvement.
5. Average Session Duration
This metric reveals the average amount of time users spend on your site during a session. A higher average session duration often indicates engaging content.
6. Conversion Rate
Conversion rate is the percentage of users who complete a desired action, such as making a purchase or filling out a form. Tracking conversions is crucial for measuring the success of your goals.
Exploring the Google Analytics Dashboard
Once your tracking code is in place, you can explore the Google Analytics dashboard to gain insights into your website’s performance.
1. Overview
The overview section provides a snapshot of key metrics like users, sessions, and bounce rate. It’s a quick way to gauge your site’s overall health.
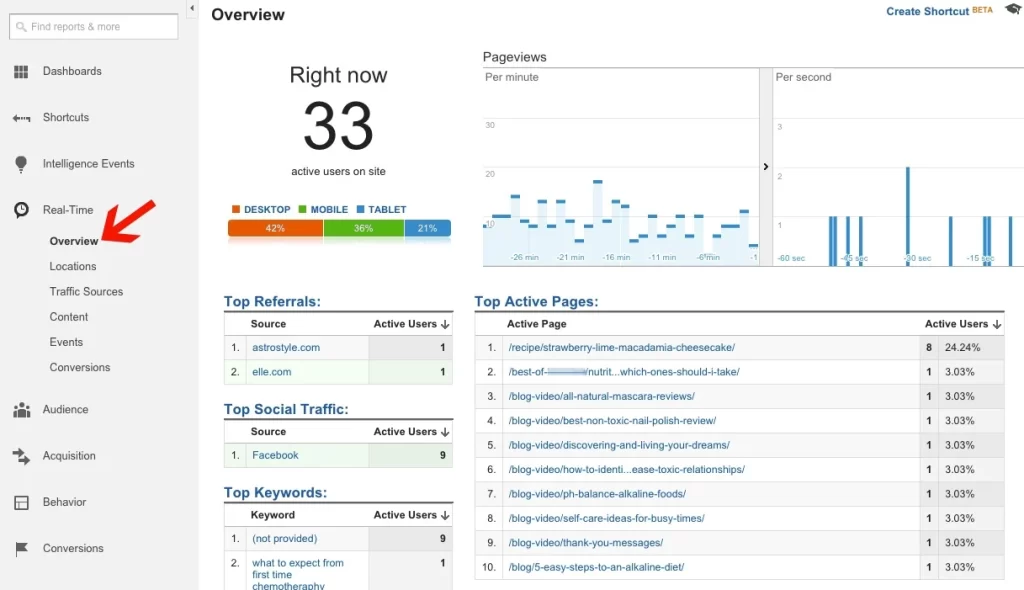
2. Real-Time
The real-time section shows you what’s happening on your site right now. You can see active users, their locations, and the pages they’re currently viewing.
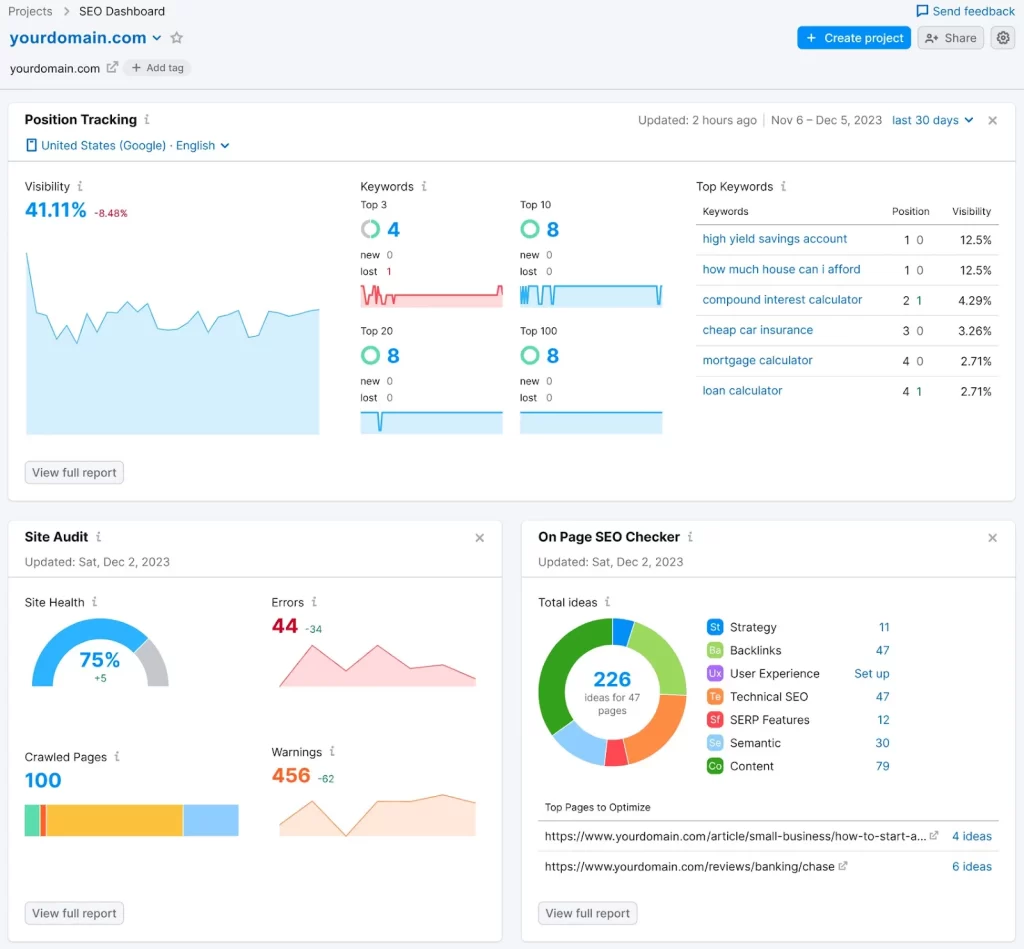
3. Audience
The audience section offers insights into your visitors, including demographics, interests, and the devices they use to access your site. Understanding your audience helps tailor your content to their preferences.
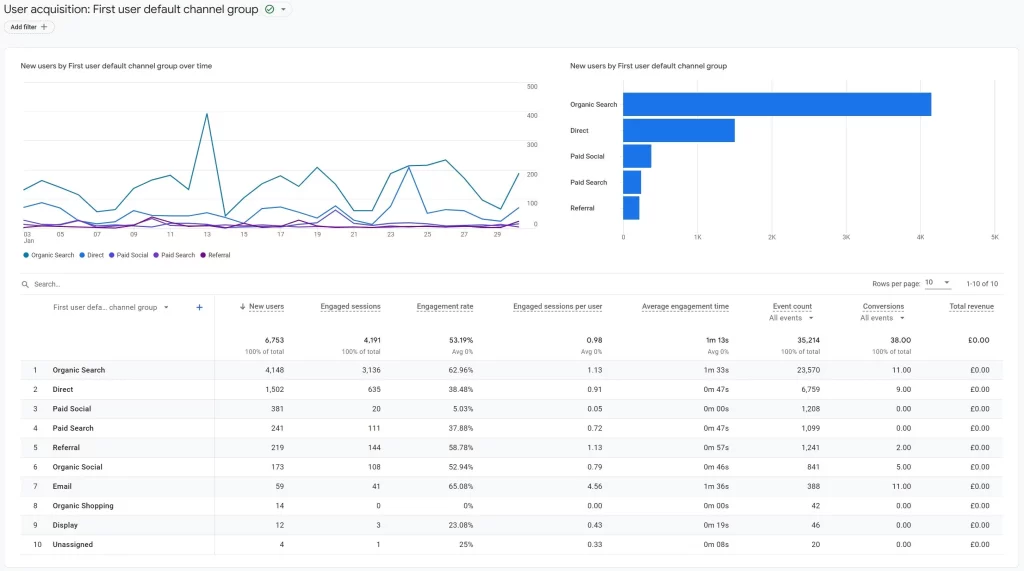
4. Acquisition
The acquisition section reveals how users find your website. Whether through search engines, social media, or direct traffic, knowing where your visitors come from informs your marketing strategy.
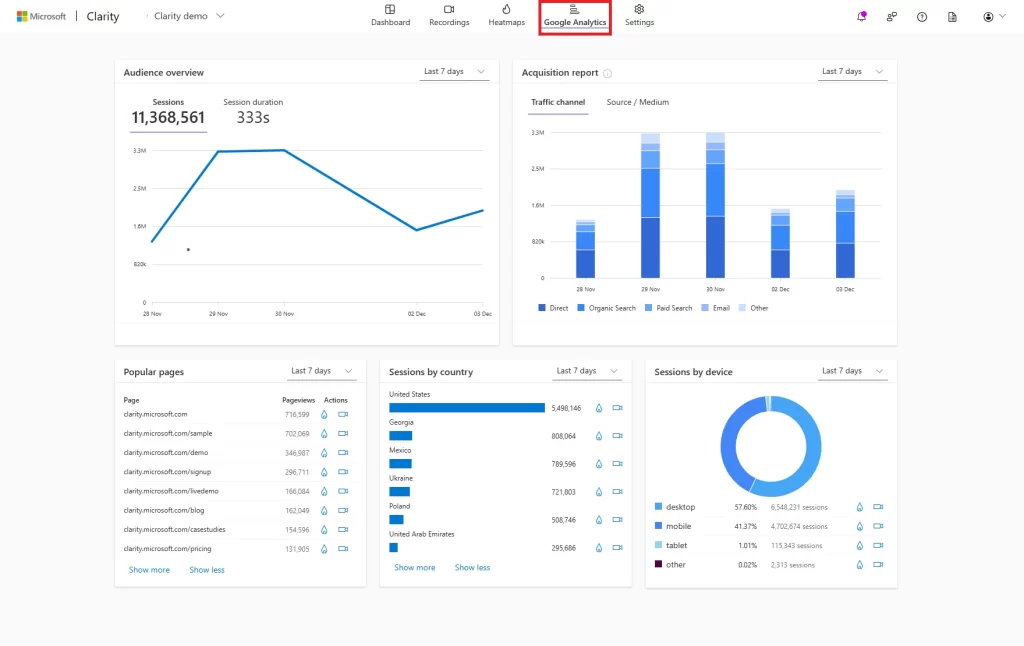
5. Behavior
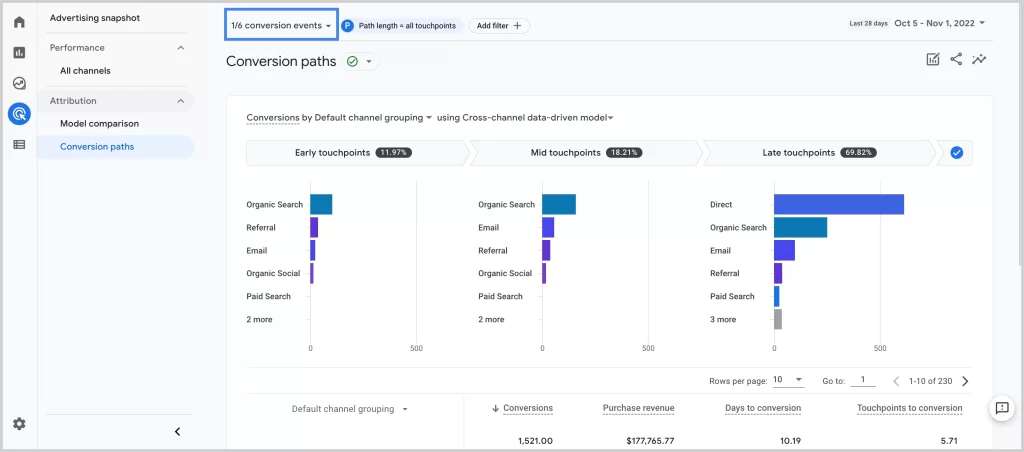
The behavior section details how users interact with your site’s content. You can see which pages are popular, how long users stay, and the paths they take through your site.
6. Conversions
In the conversions section, you can set up and track specific goals, such as completing a purchase or signing up for a newsletter. Monitoring conversions helps you understand how well your site fulfills its intended purpose.
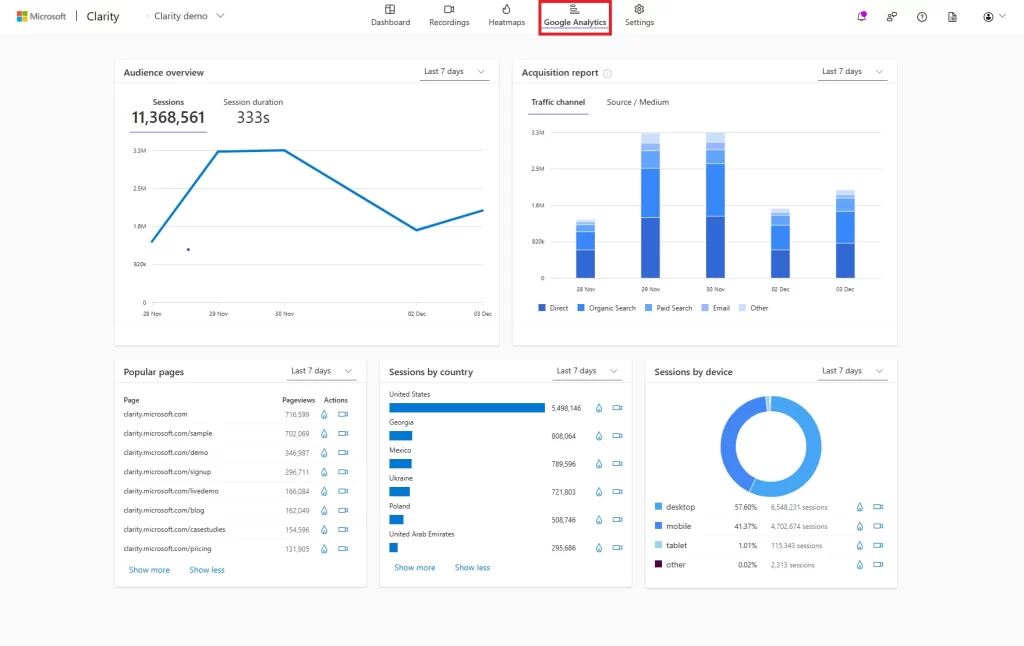
Leveraging Google Analytics for Actionable Insights
1. Identify Top Performing Content
Use the ‘Behaviour’ section to discover which pages on your site are most popular. This information helps you focus on creating similar content and optimising less-performing pages.
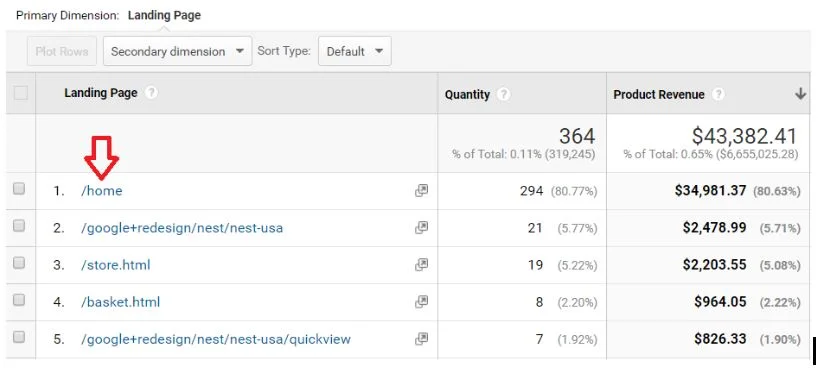
2. Understand User Flow
The ‘Behavior Flow’ report in the ‘Behavior’ section provides a visual representation of how users navigate through your site. Understanding this flow helps you enhance user experience and guide visitors toward desired actions.
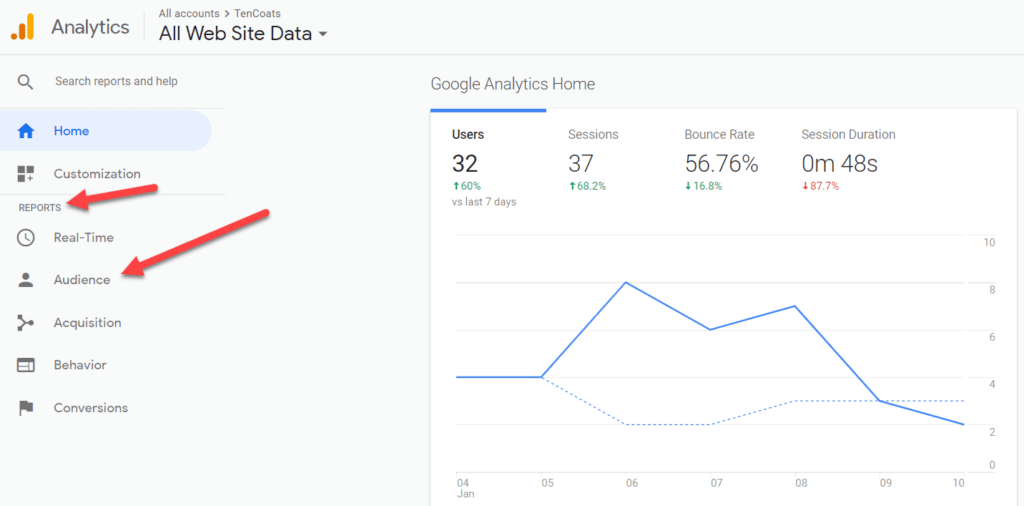
3. Optimize for Mobile
With the ‘Mobile’ report in the ‘Audience’ section, you can see how many users access your site from mobile devices. Ensure your website is mobile-friendly to cater to the growing number of users browsing on smartphones and tablets.
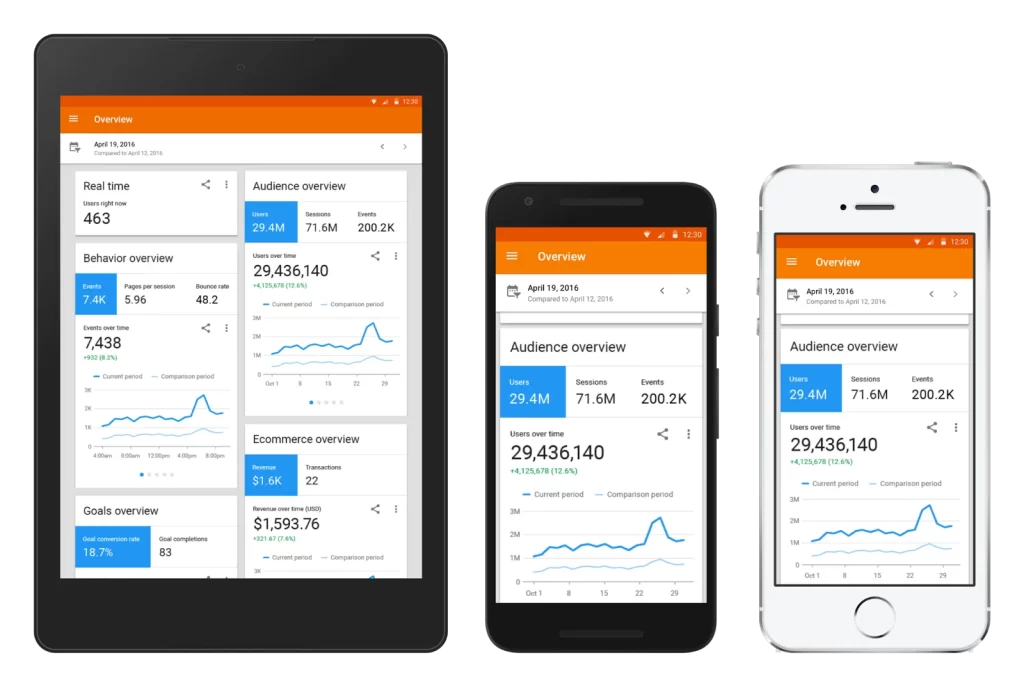
4. Track Conversions
Set up goals and track conversions in the ‘Conversions’ section. Whether it’s completing a purchase or filling out a contact form, understanding how users convert is essential for optimizing your site for success.
5. Monitor Site Speed
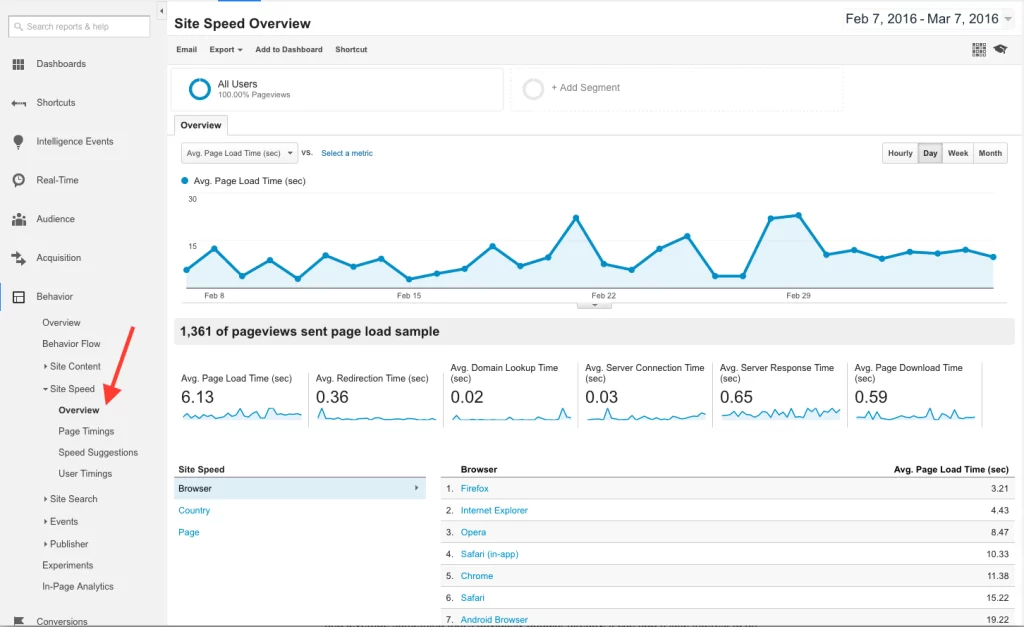
Under ‘Site Speed’ in the ‘Behavior’ section, you can assess how quickly your pages load. Users expect fast-loading websites, and slow load times can lead to increased bounce rates. Identify and address any performance issues to enhance the user experience.
6. Utilize Custom Reports
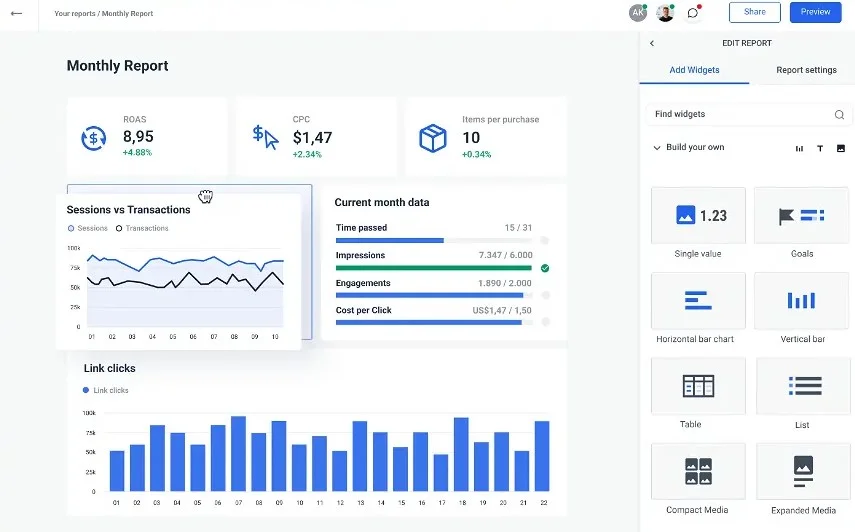
Google Analytics allows you to create custom reports tailored to your specific needs. Experiment with different metrics and dimensions to gain deeper insights into your website’s performance.
If you have any doubt with related to Optimising Website Traffic Insights you can practically learn with Six Sigma Digital Marketing Institute in Meerut City. For further questions contact us.
Address
Six Sigma Digital – 1st Floor, Kamla Complex, Opp.R.G. Inter College, Near Chaurasia Nursing Home, Chippi Tank, Meerut, Uttar Pradesh -250001
TEL – +91-7900723050, 0121 – 4065144


[…] – Google Analytics […]